
Title: Extending the OpenTelemetry Java Agent for Spring Auto-Instrumentation Subtitle: Language: en Author: Dominik Guhr Date: 2024–03–13 published_at: not yet published Keywords: java
It was Sunday, and I wanted to make sense of a kind of huge Spring codebase I stumbled upon. I had no clue what was going on in there, and I wanted observability to help me out. So I first added the official OpenTelemetry Java agent to the running app. This helped to see some Traces. Yay!
But, as the official OpenTelemetry Java Agent - for good reason, as it’s costly in terms of network throughput and storage - “just” emits traces for endpoint calls and database queries per default, I still could not make good sense of that codebase.
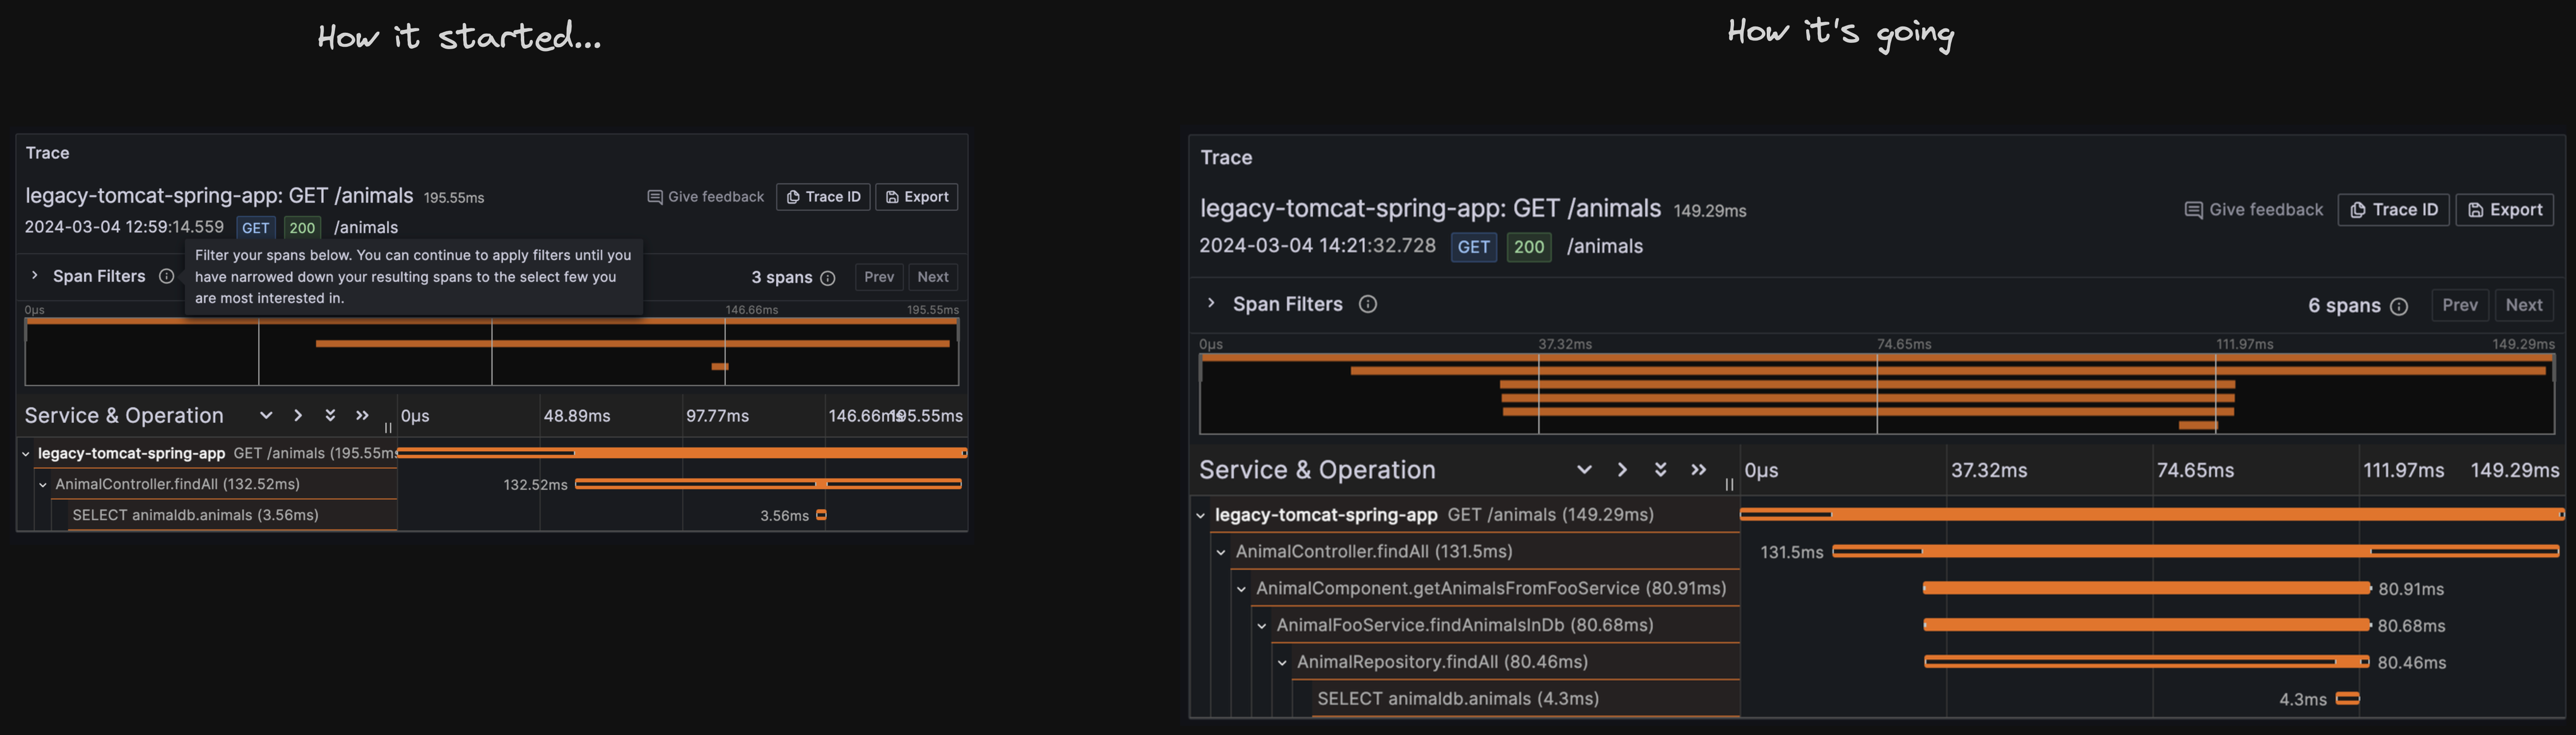
Let me explain: When you have multiple layers of code between your endpoints and your actual database calls, the default instrumentation shows you something like this:
GET /myendpoint
 MyController.DoSomething()
  SELECT foo
  SELECT bar
  SELECT baz
 ...<way more different database- or HTTP-calls to external services>
This results in a long list of spans, hard to make sense of. So, the OpenTelemetry auto-instrumentation worked, but didn’t really help me understand what’s going on in that codebase. SOMETHING happened that made all these database calls. Was it really the Controller? Or are many layers in-between, and the actual database call is made from a repository that is called from a service that is called from another service that also makes this other database call… all of this: not visible.
I wanted to improve that. I wanted to start the application, and using the attached java agent, click through it, and the emitted traces should tell me what happens inside the codebase while I’m using the application - but with a bit more sense and context. Remember: Telemetry without context is just data.
Iteration 1: Manual instrumentation using aspects
First, I thought is not possible without manually instrumenting the application, so I wrote a few aspects using Spring AOP and the OpenTelemetry SDK and API. Long story short: It worked, which is great. But it wasn’t auto-instrumentation anymore, it was manual instrumentation. I didn’t really want telemetry code to sneak into the actual codebase with more annotations, packages, dependencies, etc. - It was big enough already.
I then thought of using continuous profiling tools like Pyroscope. And those are great tools, really. But, honestly: It was Sunday, and I simply did not want to spin up another service, just to see more than the endpoint- and database-spans.
Iteration 2: Extending the java agent
So I thought: “Hey, wouldn’t it instead be possible to extend the Java agent to get the intermediate spans for every public method annotated @Component, @Service or @Repository? Somehow like the Aspect, but on ByteCode level? That’d be nice, wouldn’t it? And I’ll also learn how extending the agent works 🤩”
I got a bit excited, and again, long story short: It is perfectly possible to extend the Java agent for this use case. You can find a demo on my GitHub Repository. Using the agent extension, you’ll see the intermediate Spans.
The extension is not tied to a specific Spring environment, or in other words: It is pluggable to basically any Spring- and Spring Boot app that uses the OpenTelemetry Java agent, just by adding one JVM argument.
Please make sure to check out the README, there are a few more details covered.
I hope you find it useful :-)