
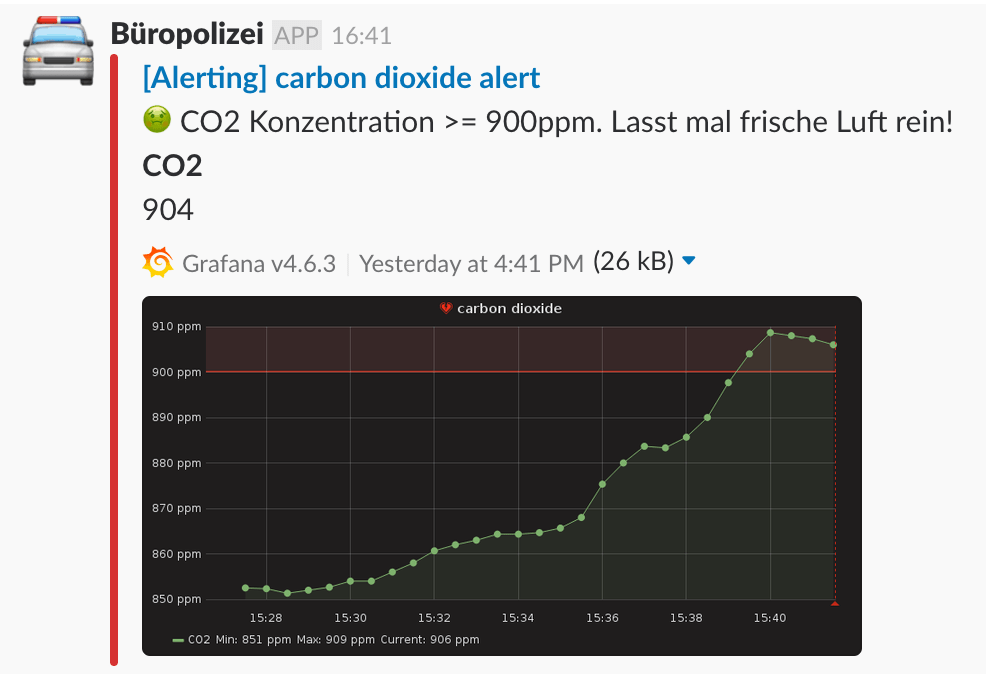
Yesterday, I started to annoy my colleagues by flooding our Slack channel with messages demanding to let some fresh air in when the air quality drops.
Somehow this drew more attention than I expected, and people wanted to know how it works. So here is a quick summary.
The other day, when my colleagues had a long discussion about how to properly air out a room by arguing about miscalculated water vapor data, I thought of one of my side projects that could actually be useful in our office.
It started a while ago because I wanted to learn Rust (a very beautiful programming language btw.) and also wanted to revisit InfluxDB and Grafana, monitoring solutions I had introduced for a customer project two years ago.
Sensor Communication
So I wrote a tiny Rust program which reads the CO2 value from a sensor connected to a Raspberry Pi. All it does is reading the register values and writing them to stdout:

extern crate byteorder;
extern crate serial;

use std::io::{Read, Write};
use byteorder::{BigEndian, ByteOrder};

fn main() {
    let mut port = serial::open("/dev/ttyS0").unwrap();

    port.write(&[0xFE, 0x44, 0x00, 0x08, 0x02, 0x9F, 0x25])
        .expect("💩 unable to write command!");

    let mut buf = vec![0; 7];
    port.read_exact(&mut buf).expect("💩 unable to read sensor data!");

    let co2 = BigEndian::read_u16(&[buf[3], buf[4]]);
    println!("{}", co2);
}
$ cargo build --release
Finished release [optimized] target(s) in 17.91 secs
$ ./target/release/k30
741Everything else I needed was already there:
Telegraf
Telegraf is a small agent developed by InfluxData which is able to regularly execute a process and store its output into InfluxDB.
### /etc/telegraf/telegraf.d/co2.conf

[[inputs.exec]]
  commands = ["/usr/local/bin/co2"]
  timeout = "1s"
  name_override = "co2"
  data_format = "value"
  data_type = "integer"
InfluxDB
influxdb is a time series database with a powerful query language. I then used moving-average which helps to even out spikes.
$ curl -s "http://localhost:8086/query?db=telegraf" \
  --data-urlencode "q=SELECT MOVING_AVERAGE(value, 3) FROM co2 WHERE time > now()-2m"  | jq .
{
"results": [
{
"statement_id": 0,
"series": [
{
"name": "co2",
"columns": [
"time",
"moving_average"
],
"values": [
["2018-02-02T11:05:50Z", 764 ],
["2018-02-02T11:06:00Z", 760.3333333333334 ],
["2018-02-02T11:06:10Z", 757.3333333333334 ],
["2018-02-02T11:06:20Z", 755 ],
["2018-02-02T11:06:30Z", 754.6666666666666 ],
["2018-02-02T11:06:40Z", 754.6666666666666 ],
["2018-02-02T11:06:50Z", 754.6666666666666 ],
["2018-02-02T11:07:00Z", 754.3333333333334 ],
["2018-02-02T11:07:10Z", 753.6666666666666 ]
]
}
]
}
]
}Grafana
Grafana is a tool to visualize your data. It comes with basic support functionality for alerts and can send slack notifications via incoming web hooks. And it make it very easy to upload images of your charts to your cloud storage or WebDAV, so you can immediately see what’s wrong, or share the graph without any singe-page app hassle.
tl;dr
Playing with Rust is fun and deploying a monitoring solution is a lot easier now than it was two years ago.